Daily Handwashing Reports
If you’re interested in learning more about this report and how it can be integrated into your SOPs, please contact your CSM for guidance on effective deployment and report literacy training.
PathSpot's reporting apparatus supports daily reports that capture handwashing activity from the previous day, based on your business's operating hours. These reports are designed for on-the-floor managers and provide timely feedback, enabling them to provide next day interventions/prescriptions when non-compliant behaviors are observed.
Note: Actual metrics and report formatting will depend on your brand’s tracking preferences (anonymous vs. employee codes) and the desired level of granularity (department-level tracking).
> Bottom of this article provides further explanation of each section

-
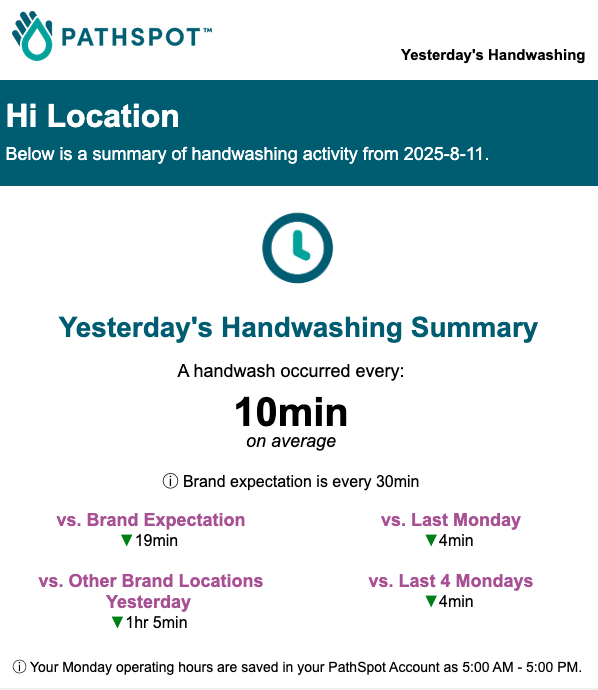
⏰ Top Section: Handwash Frequency
This section focuses on how consistently handwashing is happening, using ATBHW (Average Time Between Handwashes). You'll get a clear view of performance:
-
Compared to brand expectations
-
Across other locations within the same brand
-
Versus last week’s numbers
-
With deltas showing change from last month
Key Metric: Average Time Between Handwashes – a great indicator of routine and rhythm.
📊 Middle Section: Volume & Quality
Here, we dive into the quantity and quality of handwashing activity:
-
Average handwashes per active employee (includes anyone with at least one handwash that day - if on anonymous tracking it will be an average of all handwashes if on employee codes it will be an average of each empoloyee)
-
Rewash rate – learn more here
-
Total handwashes for the previous day
Plus, you’ll see trends compared to the previous week and month to help track progress over time.
👥 Bottom Section: Employee Activity
This section shines a light on individual engagement:
-
Highest and lowest performers by name (if employee codes are enabled)
-
A complete list of all employees who scanned in during the day
Perfect for recognizing top contributors and identifying coaching opportunities.
-
-1.png?width=500&height=125&name=PathSpot-Logo-RGB-Horizontal-1.0.0-1-e1600793653493%20(1)-1.png)

