-1.png?width=500&height=125&name=PathSpot-Logo-RGB-Horizontal-1.0.0-1-e1600793653493%20(1)-1.png)
PathSpot's real-time alert system sends immediate email and SMS notifications whenever a time or temperature threshold defined in your Standard Operating Procedures (SOPs) is exceeded.
This article explains the key information included in each alert, helping you quickly assess the severity of the issue, determine how long it has been occurring, and take the appropriate action to protect product quality and minimize waste.
Example:
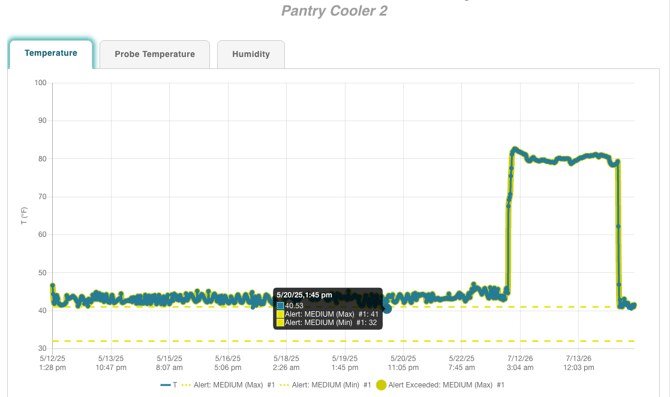
In this example, designed to demonstrate the Alert Report, a cooler recorded its last "In Range" temperature on May 20 2025 at 1:45 PM, with a reading of 40.53°F. The acceptable temperature range for this cooler is 32°F to 41°F.
The alert configuration includes a suppression time of 3 hours and a recurrence interval of 3 hours.
- Suppression time is the amount of time the equipment must remain outside the acceptable range before the first alert is sent.
- Recurrence interval is how often additional alerts are sent while the equipment remains out of range.
- If a temperature reading returns to the acceptable range at any point, both the suppression timer and the recurrence timer are reset. A new alert cycle will only begin if the equipment goes out of range again and remains outside the acceptable range for the full suppression period.
Based on this alert configuration, the first alert will be sent at approximately 3:45 PM. Please note that sensor readings are configured by default to transmit every 20 minutes, so the exact alert time may vary slightly depending on when the equipment first went offline and when the last sensor reading was received (see the alert example below).
✅ Last "In Range" Reading"
❗First "Out of Range" Reading (+3 Hours Later)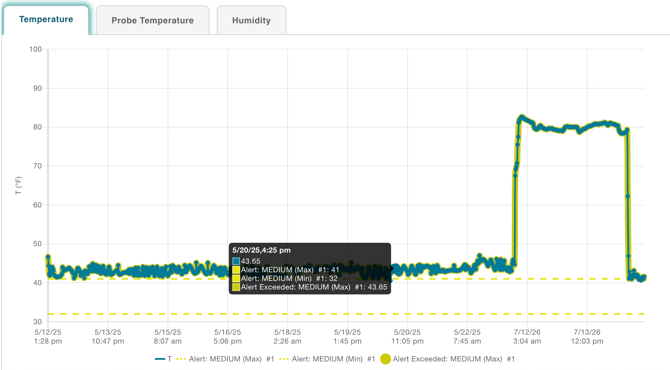
Understanding the Time Over Temperature Graph
Dashboard View — Sensor Overview Tab
(Click on the temperature reading within a sensor tile to expand and view the temperature graph.)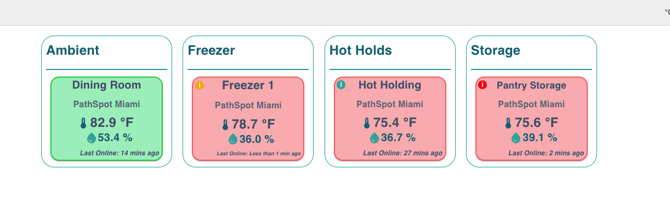
✅ In Range - Dining Room: When within range the temperature line will have no color coding
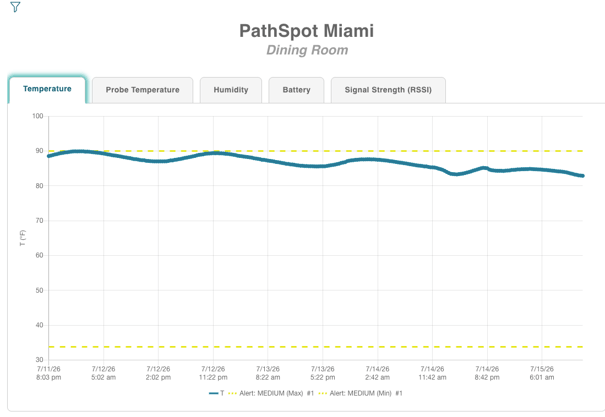
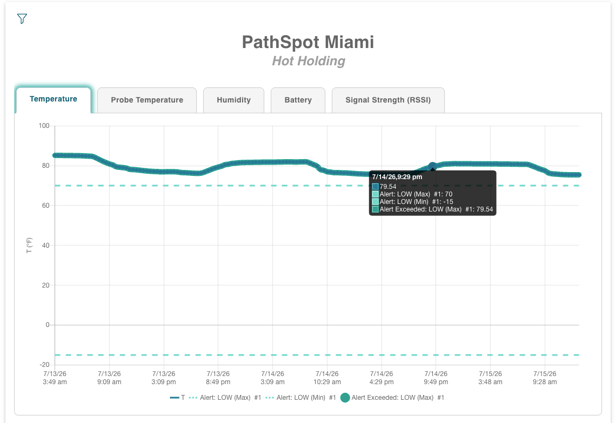
🔵 On Alert Low Criticality - Hot Holding:
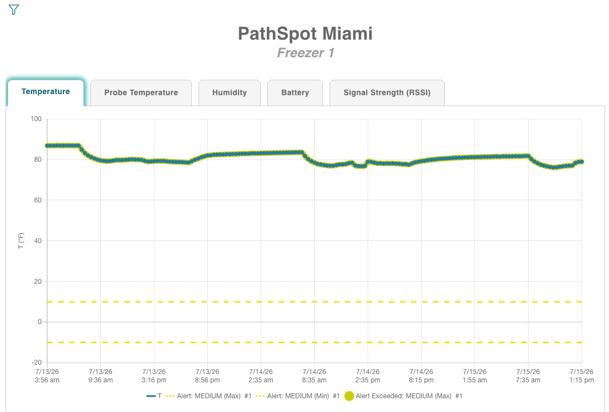
🟡 On Alert Medium Criticality - Freezer 1:
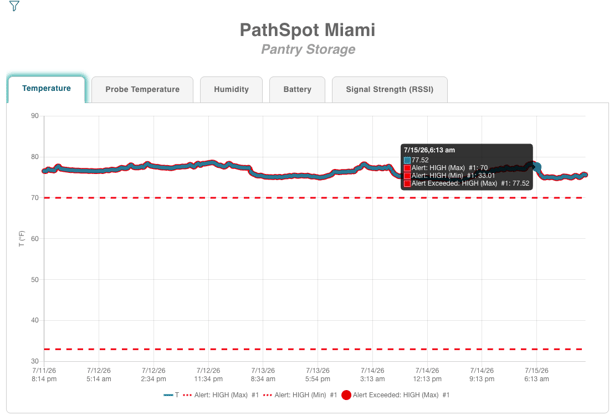
🔴 On Alert High Criticality- Pantry Storage:
🚨 Considerations
- Alerts can be stacked independently for the same alert type, with each alert having its own criteria, tier, and severity level. Alert tiers and criticalities are mutually exclusive.
- The colors along the temperature trend indicate the severity of each reading relative to your configured thresholds, not whether the equipment is currently in an alert state. The alert state is indicated by the exclamation point in the top right corner of the tile on the Sensor Overview Page
- In Medium (yellow example) the alert is set as such so all readings above that threshold appear in yellow.
- An alert notification is sent only after the configured suppression period has been exceeded. At that point, the equipment is considered to be in an alert state.
Alert Notification Example (E-mail 📧+ Text📱)
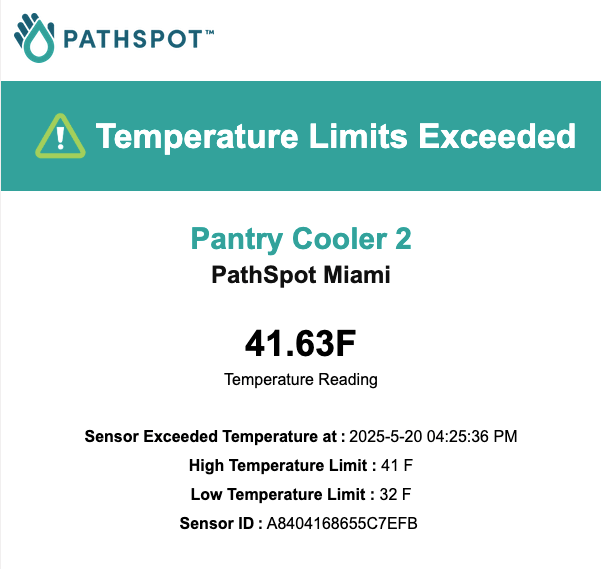
Top Section
- Sensor Name: Pantry Cooler 2
- Sensor Location: PathSpot Miami
- Current Temperature Reading: 41.63°F (the temperature at the time this specific notification was generated). If multiple alert reports are sent, this value will reflect the current temperature at the time of each report.
Bottom Section
- Sensor Exceeded Temperature At: Displays the exact time the sensor first went out of the configured temperature range. This helps you determine how long the temperature has been outside the acceptable range. If the sensor returns to the normal range and later exceeds the limit again, this timestamp will reset. If the alert continues to stay out of range this timestamp will stay the same.
- High Temperature Limit: The current upper temperature threshold configured for the sensor.
- Low Temperature Limit: The current lower temperature threshold configured for the sensor.
- Sensor ID: The Device EUI (DEV-EUI) printed on the front of the physical sensor. This unique identifier can be used to verify the sensor's