General Overview of Task Management Dashboard
General Summary & Supporting Documentation
🔐 Access
-
Access is available to anyone who has opted into our Task Management mobile application (iOS & Android).
-
This dashboard is also permission-based for both viewing and executing tasks. If you do not see this dashboard available, please contact your administrator so they can reach out to PathSpot Support at support@pathspottech.com.
- Not sure what the Task Management product is? Please refer to the linked knowledge base article for additional information.
Getting Started
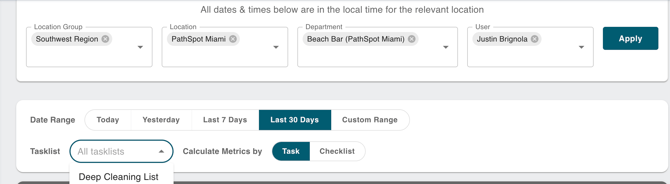
Filter Bars: Help you quickly narrow down data, from a high-level view to very specific details.
-
Filter Groups: Depending on your account structure, this lets you easily consolidate multiple store groupings. It’s ideal for district or regional managers. Location Groups are applied across all products to help better filter and organize data.
- Locations: These are your individual stores.
- Departments: sub-groupings within a store (i.e., kitchens, bars, service areas)
- Users: Individual employee-level filtering for detailed, granular insights.
Example:
Daniella manages the Southeast region of luxury resort hotels. Her Location Group includes all 25 stores in that region.
- First she selects his Location Group "Southwest"
- Then she further filters to selects the Miami Resort location to review compliance at a specific store
-
That location has three departments where checklists are completed:
-
Banquet Kitchen
Beach Bar
In-Room Dining
-
- There is one user Justin at the beach bar completing cleaning type task lists which she can select in the User dropdown.
- Now that the Location Group, Location, Department, & Users fields are all populated, she can search for a specific cleaning task list that has had a recent issue and review compliance over the last 30 days. Both filters can be utilized in the second tier of filters.
- This then be broken out by individual task within that checklist or aggregated at the checklist level
🔍 This example demonstrates how you can begin with a high-level view of regional compliance across a large dataset and drill down to a specific nightly checklist at an individual kitchen, completed by a specific employee. The level of detail shown depends on your requested level of analysis, with full visibility at every stage in between.
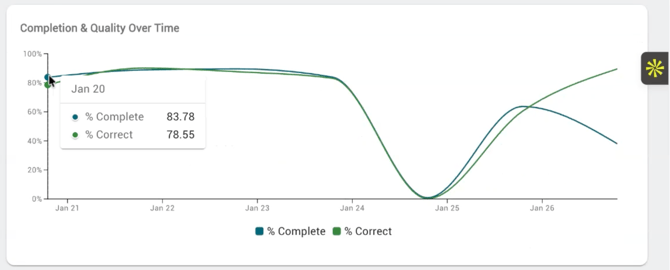
Completion & Quality Over Time Graph📈
-
Visualize completion and quality over a selected date range using a line graph. This tool is especially useful for identifying days that consistently fall below expected compliance. The program owner can then share this information with store operations to target and improve problem shifts
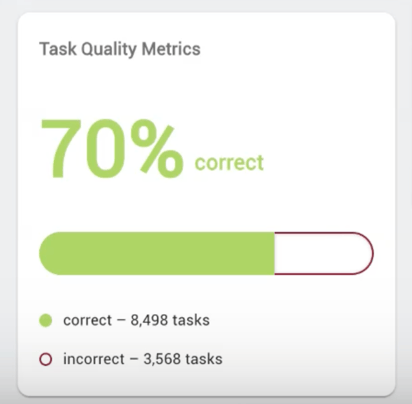
Quality Metric ("Correctness Metric)
- Tasks are marked as incorrect whether the temperature is outside the expected range or a yes/no question is answered with “No,” which then populates a corrective action. These tasks are grouped in the incorrect category, giving you an extra layer of analysis beyond simply whether tasks are being completed.
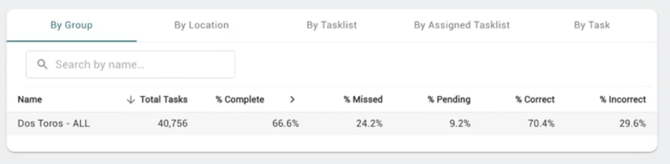
Checklist Table Data Breakdown
Group:
Aggregates data at a regional level (i.e Southwest Region) to give a high-level view of how all locations in that region are performing.
Location:
Lists individual stores within the selected group. In the previous example, this would show all 25 stores and aggregate their total tasks and completion percentages, each line consolidating data for that given store.
Task List:
Rolls up data for a specific task list across the selected group or locations. For example, if the Southwest Region has 10 checklists per store, this view aggregates data for those 10 checklists across all 25 stores. One line = one checklist across 25 stores.
Assigned Task List:
Breaks the task list down further into individual assignments for more granular analysis. For example, within an Opening/Closing checklist, this would separate assignments by meal period (Breakfast, Lunch, Dinner).
Task:
Aggregates data at the individual task level, using the same logic as the previous items, but focused on a specific task.