Downloading Reports from the PowerDashboard
PathSpot allows users to download five distinct report types directly from the PowerDashboard. Reports are available in two formats:
-
PDF – For aggregated visually oriented summaries
-
CSV (Excel) – For detailed raw data
This provides your team flexibility for both high-level overviews and extended in-depth analysis.
Getting Started
-
Log in to the PowerDashboard (link)
-
Once logged in, a tabbed panel will appear on the left-hand side, providing access to each product within the SafetySuite.
-
This guide focuses on Task Management, where you can view and download data from completed task lists submitted through your PathSpot App.
Generating Reports
1. Navigate to Task Management
Click on the Task Management tab in the left-hand panel.
2. Click "View Task Lists" OR "Tasks Dashboard"
Select Either to access all task lists available to your account (Task Dashboard is permission based)
3. Download Report
If you have reporting permissions, a navy Download Report button will appear at the top right of the screen.
-
Click this button to download the desired report in your preferred format.
-
If you don’t see the button but believe you should have access, please contact:
📧 support@pathspottech.com

*All report types support multi-day & multi-location parameters. Note, there are limits to data pulls which will lead to large reports timing out.
Quick Tip: When pulling for a report, you can leverage the date dots on the date selector to see which days have responses. Pulling for a date without the dots will generate an empty report!
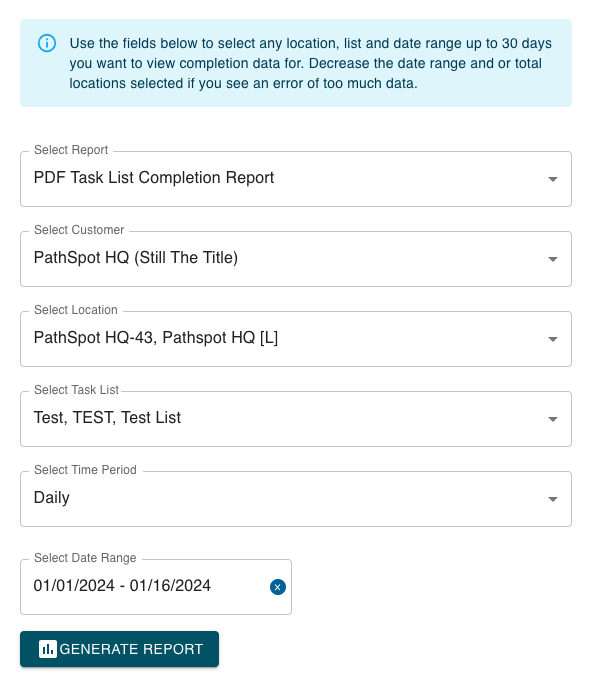
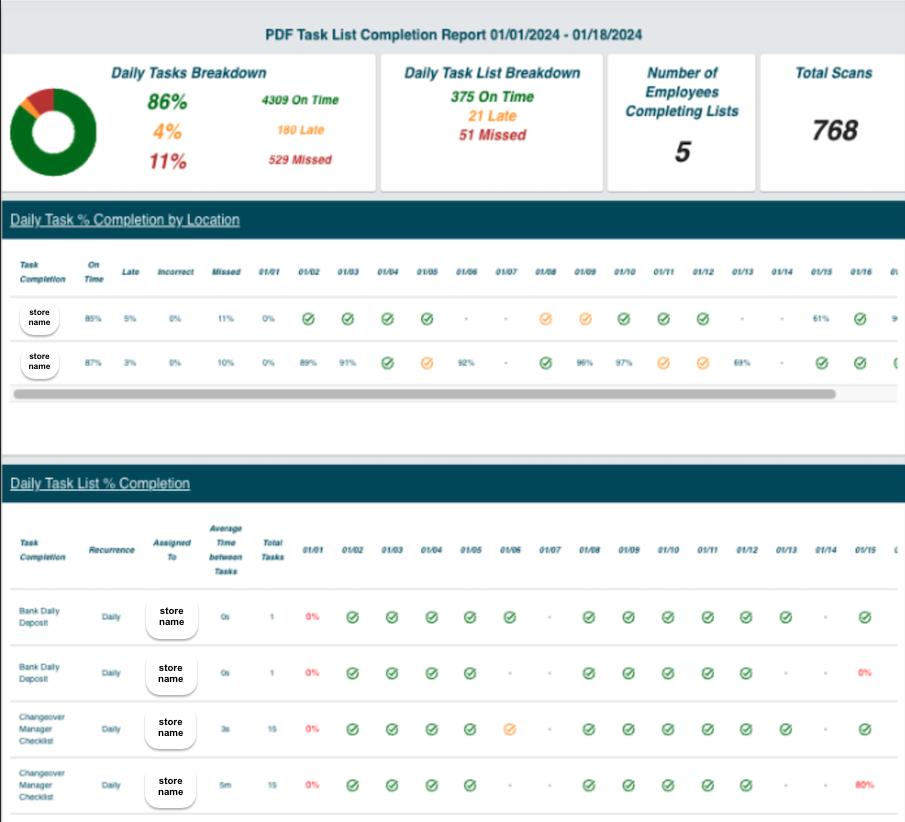
1) PDF - Task List % Completion
Aggregate PDF view providing percentage completion by task & location
OUTPUT
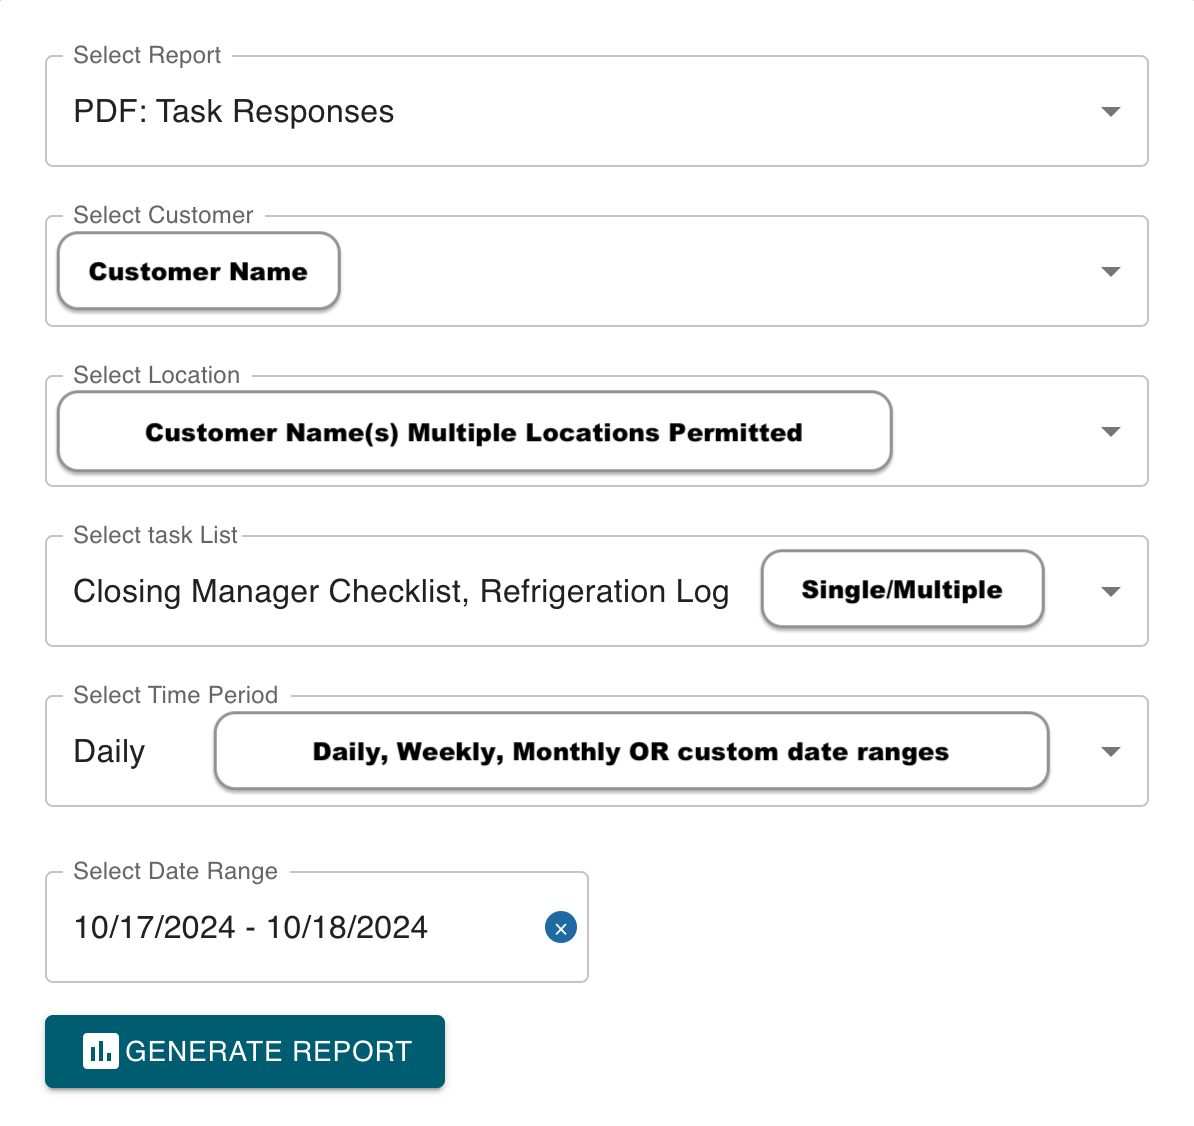
2) PDF - Task Responses
Use Case Individualized PDF report allowing for a more granular view of task responses by list(s), location(s), day(s)
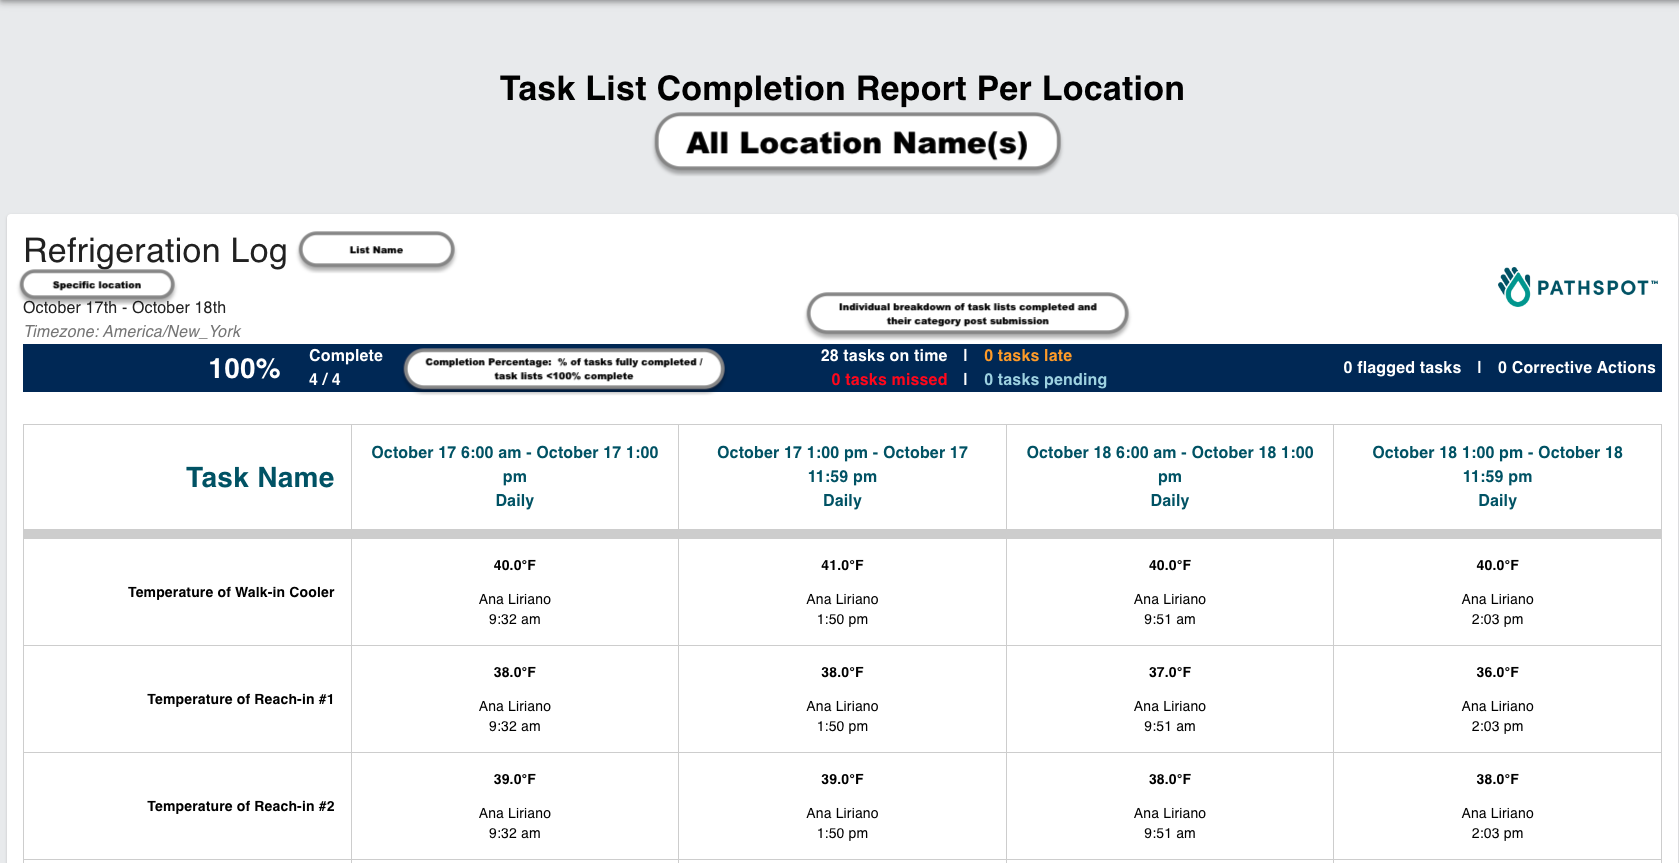
Notable Report Details
- Task List Organization: Each box/page in the report corresponds to an individual task list.
- Data Orientation: When multiple days are requested for the same task list, all relevant information will be displayed within the same box/page. The report includes data for each day within the specified date range, and you can use the horizontal slider at the bottom of the page to navigate through the dates.
- Daily Assignments: Each task list assignment is displayed for a specific day. For example, if a task list appears 3 times; at breakfast, lunch, and dinner, each assignment will have its own column. Assignments are arranged chronologically from left to right.
New Features
- Completion Percentage: The report now includes a completion percentage at the top for quick reference.
- Color Coordination: Enhanced color coding allows for easy identification of problematic lists, times, and days.
- Image Collation: In addition to images populating in the respective task, all images taken will be also be compiled as large high resolution pictures at the bottom of the report.
Data Pull Limitations
- Please note that there are limitations on data retrieval. A rough estimate is that one store can generate around 20 task lists for a months worth of data.
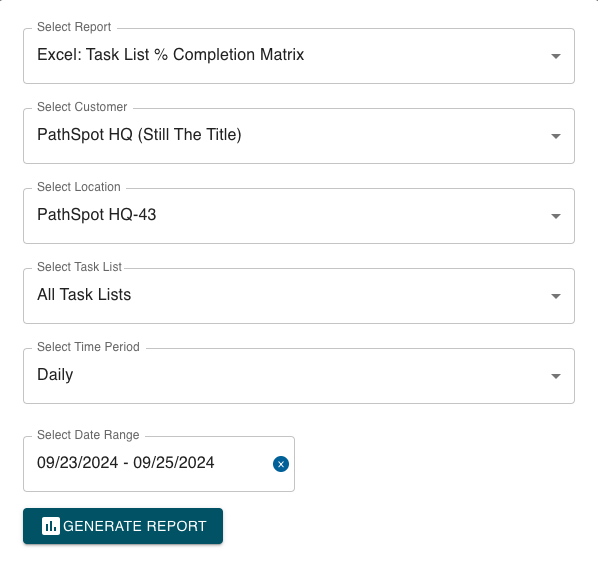
3) Excel: Task List % Completion Matrix
CSV Download which tracks percentage completion by cadence (daily, weekly, monthly, adhoc) & list across single or multiple locations for a specified date range
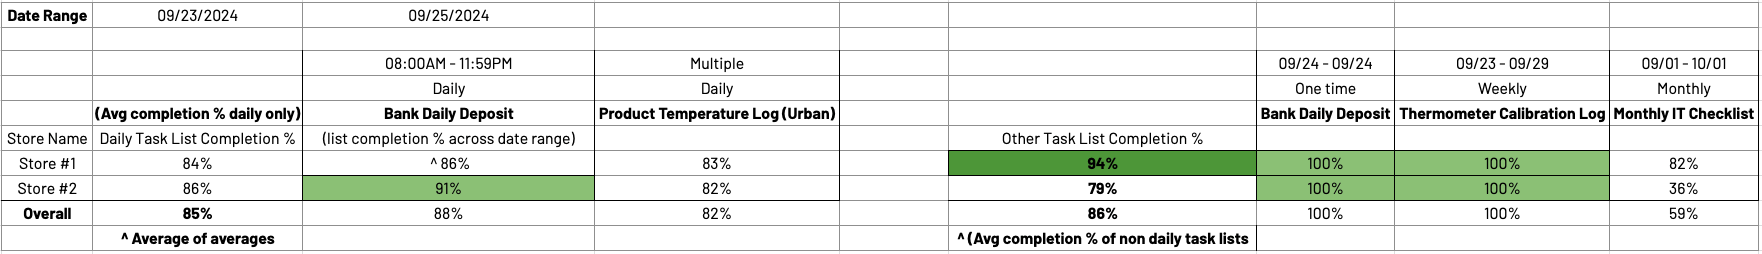
> Each "inner" cell (i.e. Bank Daily Deposit, Product Temperature Log ect..) is calculated by dividing the total number of tasks completed during the specified time range by the total number of tasks that could have been completed in that same period. The number of tasks considered may vary each day, depending on whether subtasks are involved in the responses.
>Each overall cell (i.e. Overall, Daily List Completion %, Other Task List Completion) is calculated by averaging each percentage in that category
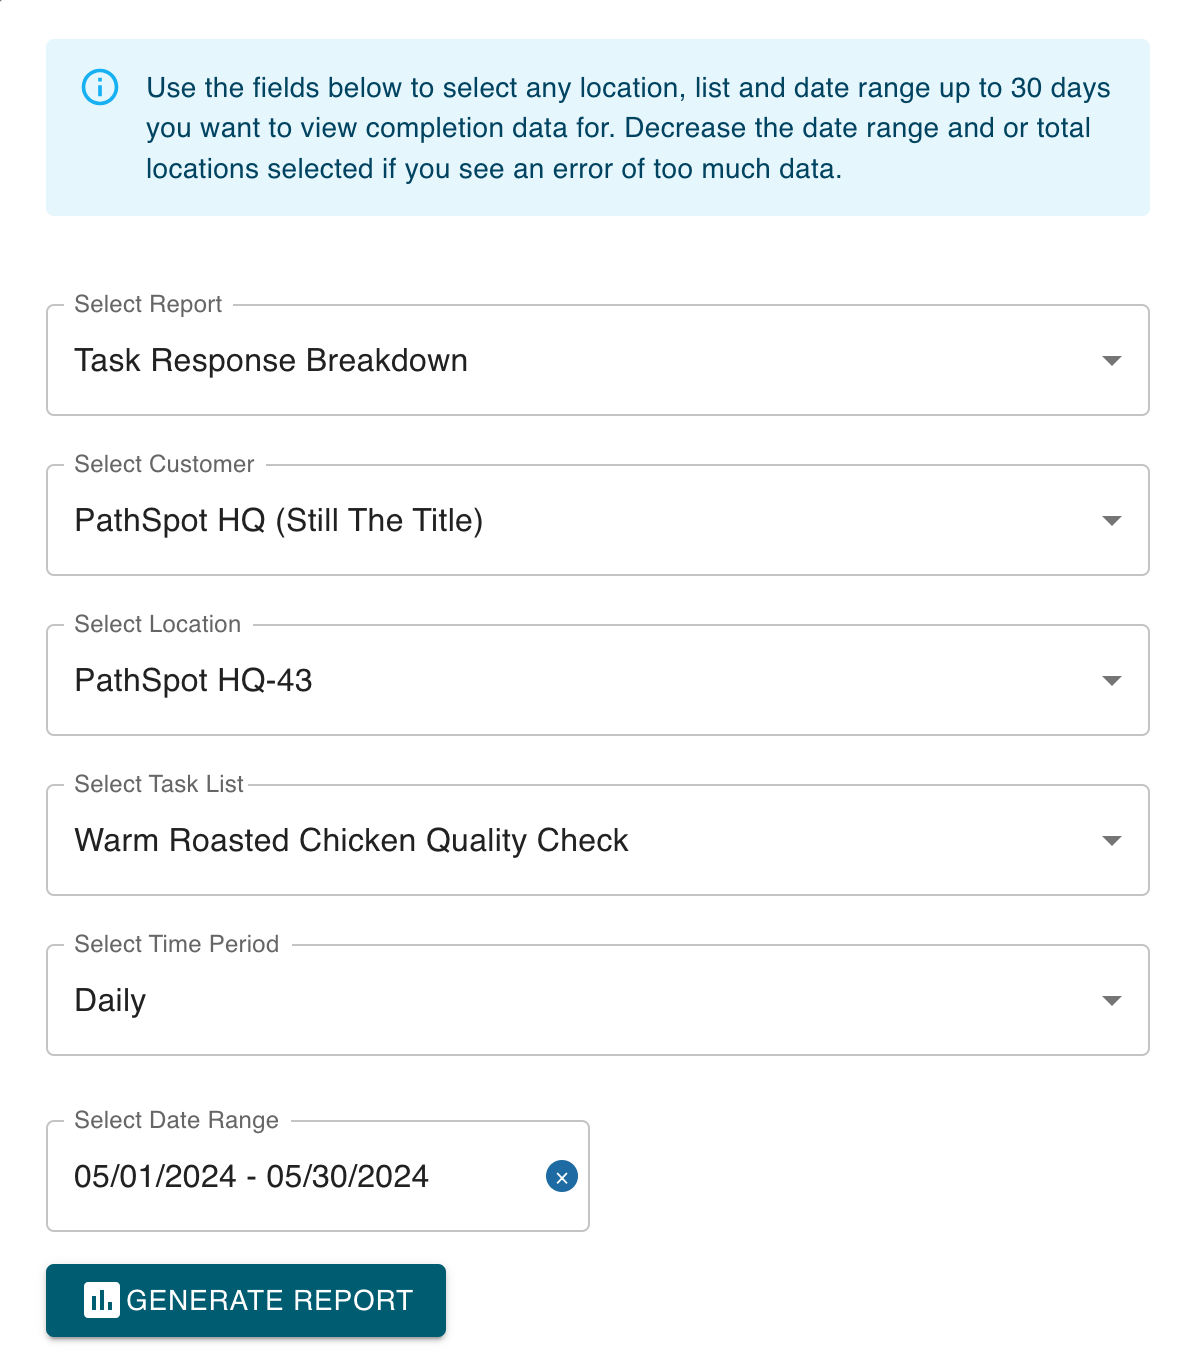
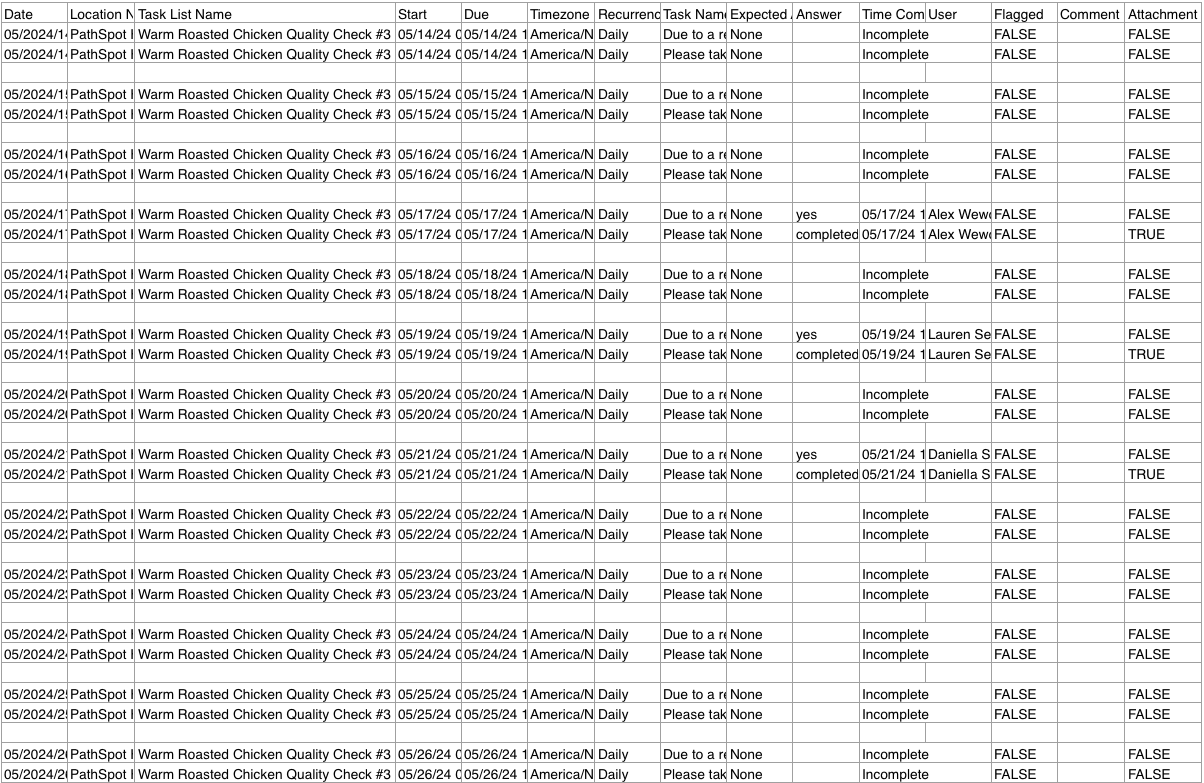
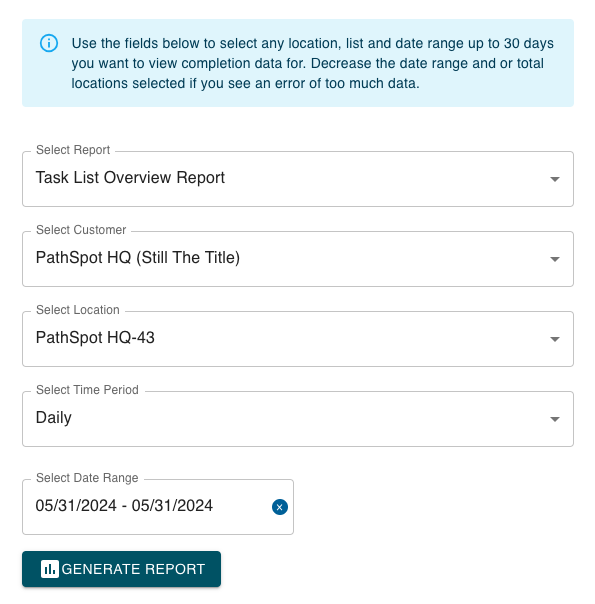
4) Excel: Task Responses
Need to drill down to get all of the data for a specific location or list? This is the option for you! Quickly get CSV exports which include all raw data inputs for a given location, date, & task list(s).
OUTPUT
5) Excel: Task List % Completion
CSV download aggregating quantity of tasks completed by category
OUTPUT
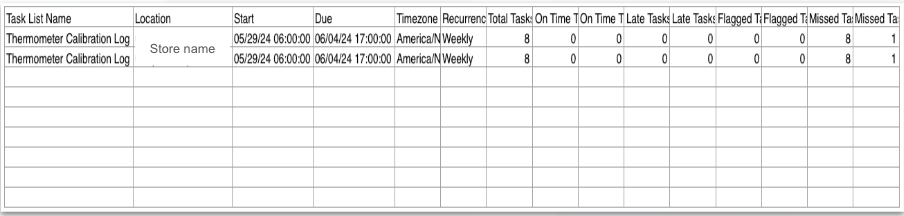
This report is great for tracking whether one-time checklists; such as those specific to an LTO are completed on time or late as it provides a quick, holistic view of checklist completion by store.