HACCP-Compliance Automated Reporting
Say goodbye to piles of paper and hello to streamlined digital record-keeping. Access HACCP digital temperature forms directly through your PathSpot Dashboard! (Through any web browser URL "pathspot.app").
Temperature collection and record-keeping are now fully digital. All your daily AM and PM checks are securely stored in our database and can be easily retrieved and downloaded with just a few clicks.
Getting Started!
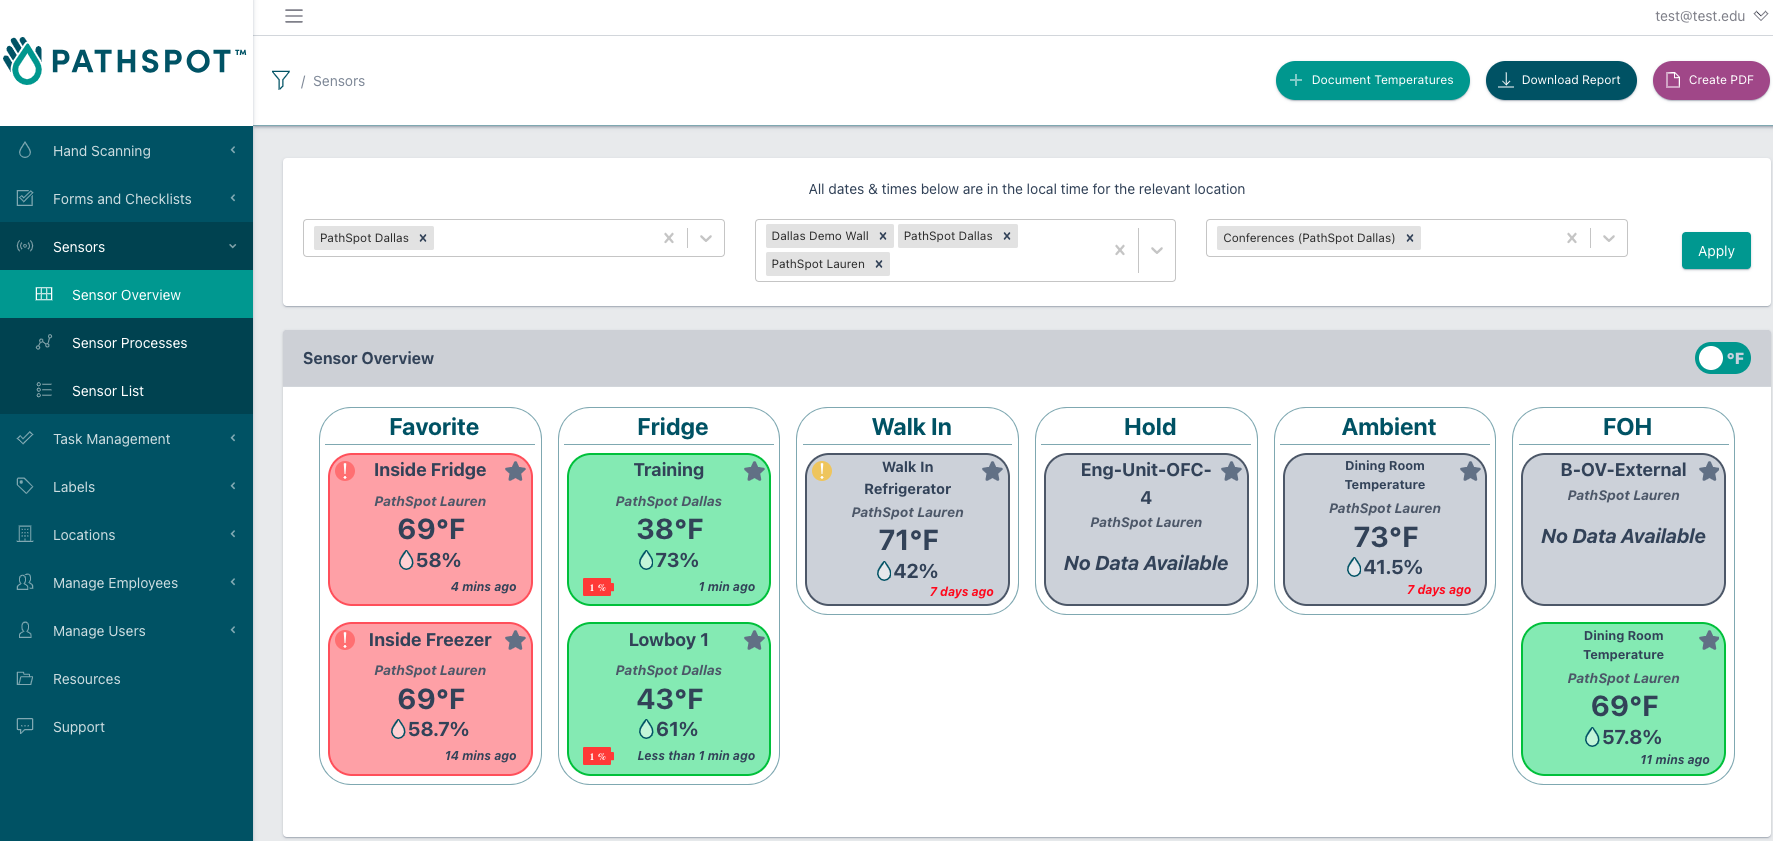
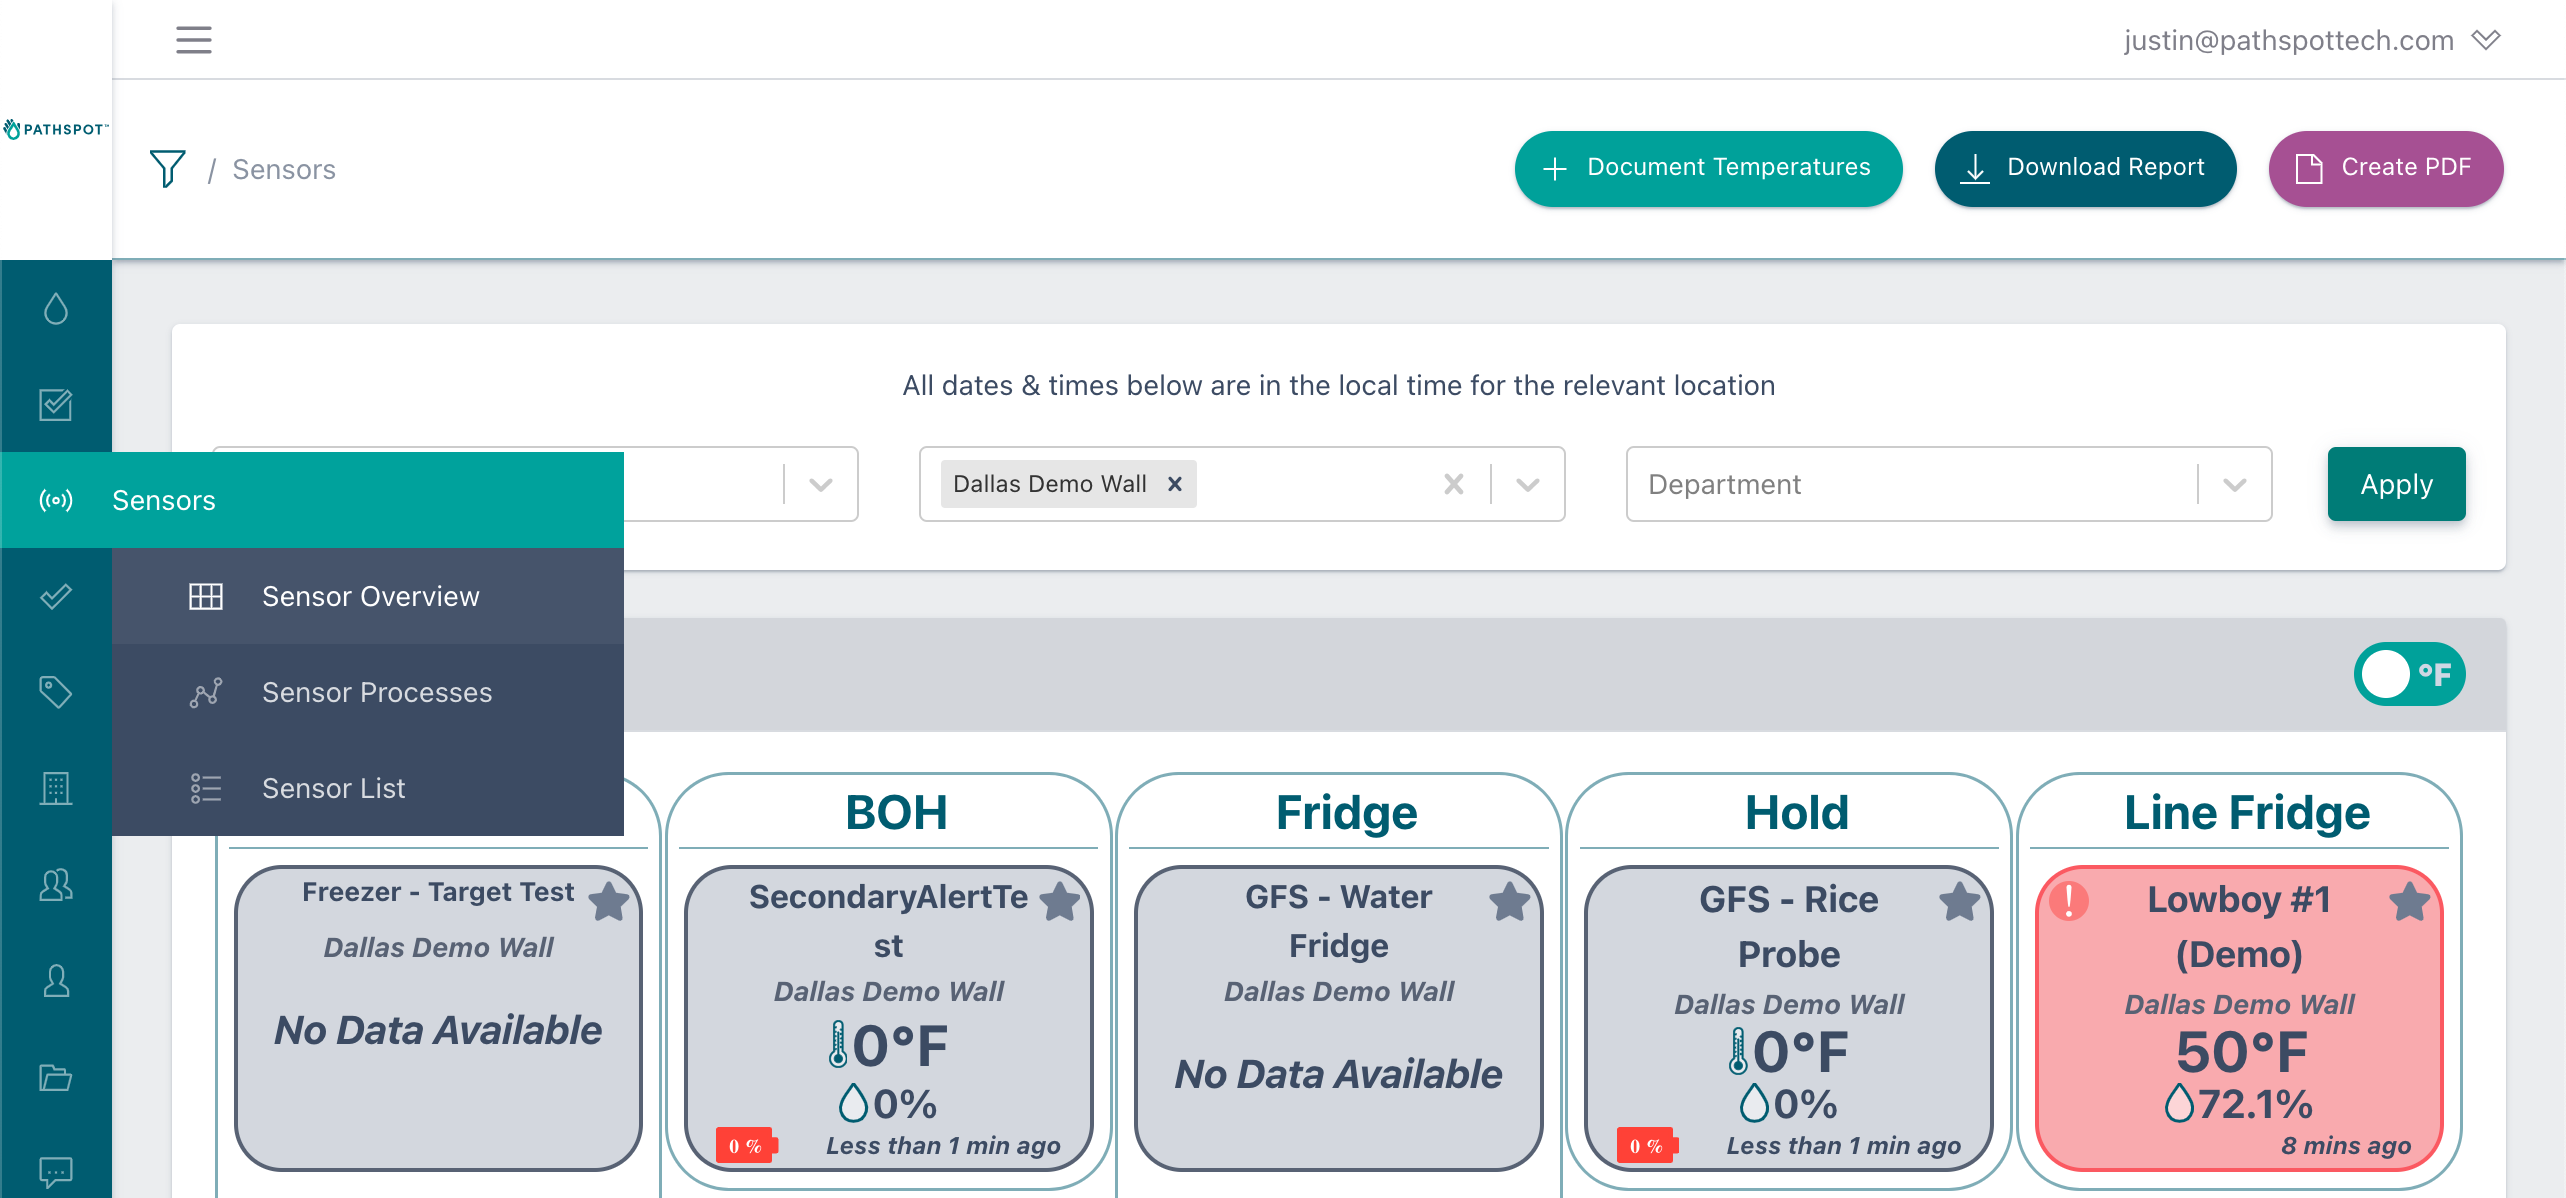
To begin, navigate to the "Sensor Overview" tab on your dashboard homepage. You’ll find three new buttons in the top right corner: Document Temperature, Download Report, and Create PDF.
> If you don’t see these buttons, you may not have the appropriate permissions. For assistance, please contact support@pathspottech.com.
> Video guidance below
1) Generating HACCP Forms
✅ Signing Off on Equipment
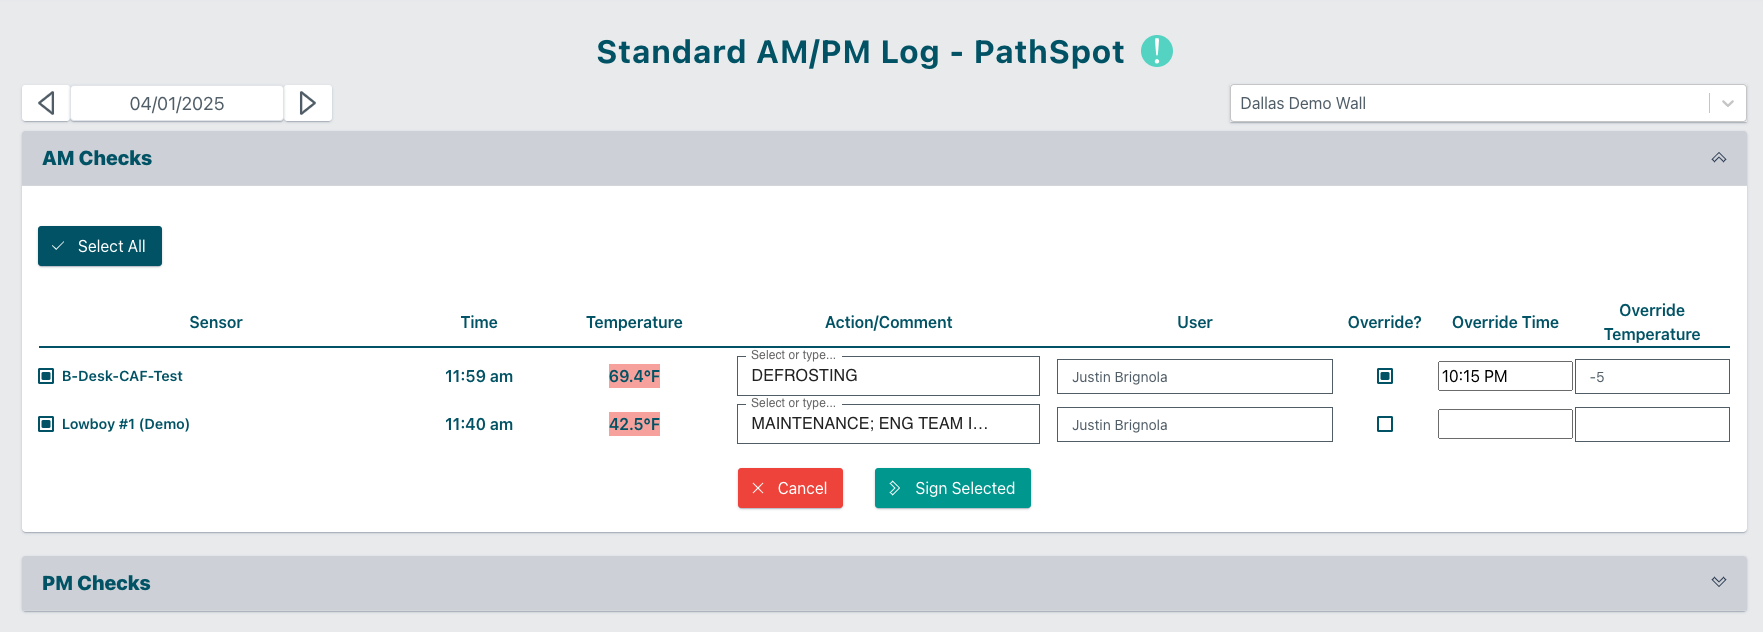
- Before generating your report, it's recommended to validate and approve the recorded temperatures for the month using the Document Temperature button.
- This can be accessed by clicking the "Sensor Overview" tab under "Sensors" on the left-side panel. Once selected the "Document Temperature" button will be in top left (This button is permission based - if you do not have it PathSpot support will need to confer access)
- In this section, you can review and sign off on the temperatures recorded during the AM and PM timeframes (configurable via PathSpot Support).
- If any temperatures were out of range and corrective actions need to be taken, a list of common interventions are provided by clicking in the field to streamline the approval process.
- If none of the provided options apply, you can manually enter corrective actions in the "Action/Comment" field.
📝 Note: All corrective actions, comments, overrides, and signatures are tracked in the system. However, only the most recent entry will appear in the final downloaded PDF.
2) Downloading Reports
Once you've completed the sign-off process, you're ready to download the report.
To do so, click Download Report and fill in the required fields:
-
📅 Date Range (month by month)
-
📍 Location
-
📝 Form Report (AM/PM Log or if named something different upon initial setup)
-
🌡️ Desired Unit (°F / °C)
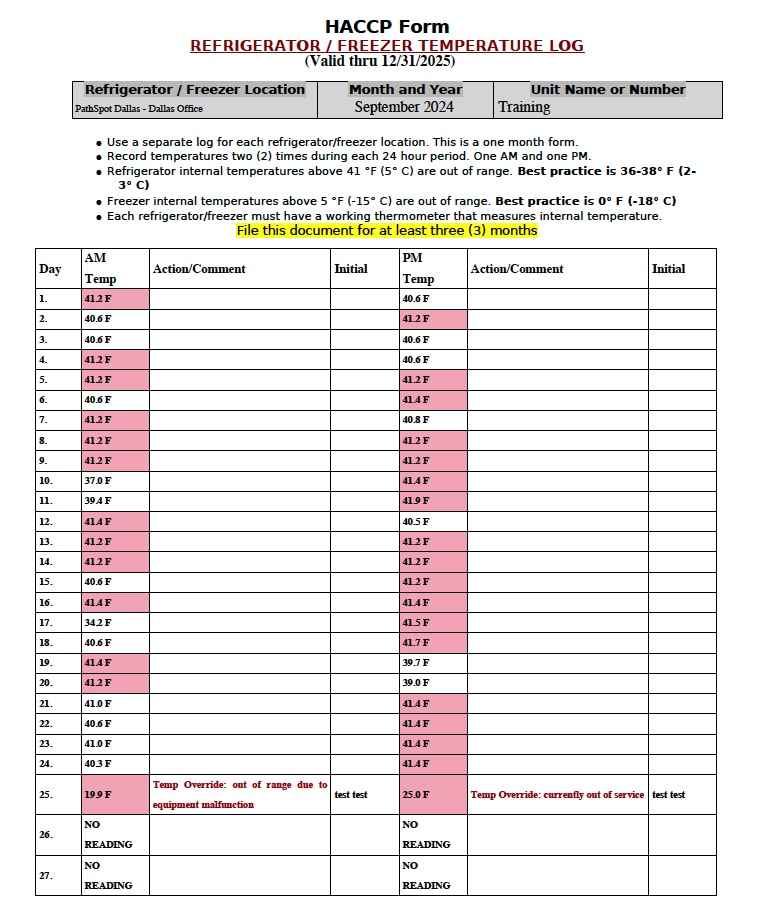
Each page of the report provides a summary view of the AM and PM checks for every individual sensor within the selected month. You’ll see this summarized in the top header under "Unit Name or Number."
-
AM temperatures for each day appear on the left side.
-
Corresponding PM temperatures are shown on the right side.
By request, any temperatures that were out of range can be highlighted in red for quick identification.
By default, the final report will be generated without any color coding, displaying plain temperature values only.
Tile Features
Each section of the tile is hyperlinked, offering additional insights or functionality when clicked. See below for a breakdown of each feature.
These tiles can also be integrated onto our HandScanner, allowing employees to monitor temperatures while washing their hands!

⚠️ Alerts
If a sensor is in alert status, an exclamation mark will appear in the top-left corner of the tile. The color of the icon indicates the alert's severity:
-
🔵 Blue = Low
-
🟡 Yellow = Medium
-
🔴 Red = High
😴 Snooze
You can temporarily silence alerts for a specific sensor—but only when it's in alert status:
- Click the Snooze button and select a date to pause notifications until that time.
⚠️ Be cautious when selecting an end date, as it cannot currently be changed without assistance from PathSpot Support.
🏷️ Sensor Name
Clicking on the sensor name will open detailed sensor information, including:
-
Unit type
-
Category
-
EUI
-
Associated alert parameters
🔧 Learn more here about modifying alert settings.


🌡️ Temperature
Displays the most recent reading from the sensor.
-
Reading Timestamp: Located in the bottom-right corner, showing the time of the last update (e.g., Last Online: XX minutes ago).
-
Ping Interval: By default, the sensor sends a reading every 20 minutes.
🔍 Clicking on the temperature value opens a time-over-temperature graph, explained further below.
💧 Humidity
Shows the current humidity level next to the water drop icon.
-
For a more detailed view of humidity and temperature trends, click on the tile to access the graphs below.
-
Clicking on the humidity will also open the time-over-temperature graph.
🔋 Battery Life
-
Battery status is shown in the bottom-left corner of the tile.
-
A warning symbol will appear when battery life drops below 10%.
📶 RSSI
- If you suspect certain sensors are not receiving adequate signal strength, reach out to our support team for more information <support@pathspottech.com>
📈 Understanding Your Temperature Graph
-
All alerts are displayed and color-coded on the graph based on the previously mentioned severity scale:
-
🔵 Blue = Low
-
🟡 Yellow = Medium
-
🔴 Red = High
-
-
Dotted lines represent the upper and lower thresholds for each alert level.
-
The teal/blue line shows the actual temperature readings over time.
- The outline color of this line reflects the most severe active alert at that point in time.
-
-
If both medium and high thresholds are exceeded, the outline will be red.
- If only the medium threshold is exceeded, it will be yellow.
-
⚠️The highest level of alert always takes precedence when determining the line color.
🛠️ Additional Features
-
📄 Create PDF: Generates a PDF report based on the currently selected date range.
-
📊 Export to CSV: Downloads a CSV file containing every individual reading and its corresponding timestamp within the selected date range.
> Video guidance below

How Temperatures are captured & timestamps are recorded
If the Sensor is currently on alert: We select the first temperature and time value of when the sensor crossed into the alert threshold.
Example: If the sensor went on alert at 12:00pm we take that time and temperature.
If the Sensor is NOT currently on alert, but DID alert in the time and date range for the report: We select the first temperature and time of when the sensor first went on alert. We look at the most recent alert which is the highest criticality alert (highest temp limit).
Example: The sensor went on alert at 11:00am and was corrected before the AM period was over at 12pm. We would take the 11am time and temperature. We want you to know the sensor was out of range even if it is now fixed. This is where overriding and comments come in handy!
If the Sensor is OUT of range but has not been on alert for the time and date range for the report: We select the most recent data point where the sensor was NOT on alert.
Example: The sensor is out of range but not enough time has elapsed for it to be on alert -- i.e. at the time the AM report was generated a door was left open so it was out of range for just a few minutes. If that sensor continues to remain out of range the PM check will properly highlight it but the AM would not.
If the Sensor is not out of range and doesn’t have an alert: We look at the most recent temperature reading we have (within the past hour).
Validating_Temperatures (Sensors).mov Download